
Introduction
“Do I really need to learn Python, or is Excel still enough?” is one of the most common questions aspiring data analysts ask in 2026 — and the honest answer, backed by real hiring data, is more nuanced than either extreme suggests. Excel isn’t dead. Python isn’t strictly mandatory. But the gap between candidates who know only Excel and those who’ve added Python to their toolkit has become one of the clearest, most consistent salary differentiators in the entire data analytics job market.
This guide breaks down exactly what current hiring data shows, why this specific skill gap exists, and how to close it strategically.
The Data: What Job Postings Actually Ask For
Before drawing conclusions, it helps to look at what real job descriptions are asking for right now. Multiple 2026 analyses of live job postings converge on a consistent pattern:
| Skill | % of Job Postings Requiring It (India-focused analysis) | % of Job Postings Requiring It (Global analysis) |
|---|---|---|
| Excel | 81% | 35% |
| SQL | 60% | 72% |
| Power BI | 43% | 40% |
| Python | 41% | 53% |
Sources: AccioJob analysis of 328 India-focused job descriptions; DEV Community analysis of 2,585 global Data Analyst postings, 2026.
Notice something important here: the two data sets seem to disagree, but they’re actually telling the same underlying story from different angles. In the India-focused sample, Excel still dominates because “Data Analyst” job titles span everything from basic Excel-and-MIS reporting roles to advanced SQL-and-Python analytics seats — a single title covering a genuinely enormous range of actual responsibilities. In the more advanced, global sample — which skews toward higher-paying, more analytically demanding roles — Python has actually overtaken Excel in demand (53% vs. 35%).
The real insight: Excel remains the baseline that gets your resume past initial filters. Python is what moves you up the offer ladder into better-paying, more analytically sophisticated roles.
Why This Specific Gap Exists
Excel has run business operations for decades, and it isn’t going anywhere — pivot tables, lookups, and quick ad-hoc analysis remain genuinely useful, everyday tools. But Excel hits real limitations that Python simply doesn’t have:
- Scale — Excel struggles with hundreds of thousands of rows; Python (via Pandas) handles millions without breaking a sweat
- Automation — a Python script can automate a weekly report that would otherwise take hours of manual Excel work every single time
- Reproducibility — Python code documents exactly what was done to the data, step by step; an Excel workbook full of manual clicks often can’t be easily audited or repeated
- Advanced analysis — statistical modeling, machine learning, and complex data transformations are native to Python’s ecosystem in ways Excel simply wasn’t built for
This is precisely why Python has moved from “nice to have” to what one 2026 industry analysis called a “standard expectation” for companies hiring analysts — it handles the work Excel structurally can’t.
The Salary Differentiator Is Real
This is the part that should genuinely motivate anyone on the fence about learning Python: it correlates directly with higher pay, even when it’s not the only factor at play.
Based on current 2026 salary data tied to specific skills:
- Excel-only roles tend to sit at the lower end of the analyst salary band, often in the ₹82,000–89,000 range for baseline “table stakes” skills (SQL and Excel) in global data
- Adding Python consistently pushes analysts into a noticeably higher salary tier one 2026 industry analysis found Python appearing far more often in the higher-paying roles it studied, functioning as a clear marker of more analytical, higher-value positions
- In the Indian market specifically, mid-level professionals (3–5 years) who add Python and a BI tool to an Excel/SQL foundation typically move into the ₹8–18 LPA band a significant step up from Excel/SQL-only roles at similar experience levels
The pattern is consistent across nearly every analysis: Excel and SQL get you hired. Python helps you get hired into something better.
What Python Actually Adds to an Analyst’s Toolkit
For those wondering exactly what Python brings to the table that Excel can’t, the core skill set centers on a handful of specific libraries:
| Python Tool | What It Does |
|---|---|
| Pandas | Loading, cleaning, filtering, and merging large datasets efficiently |
| NumPy | Numerical calculations and array-based operations |
| Matplotlib / Seaborn | Building clear, customizable data visualizations |
| Jupyter Notebooks | Documenting analysis in a reproducible, shareable format |
Crucially, learning Python for data analytics doesn’t mean becoming a software engineer — it means becoming fluent enough in these specific libraries to clean messy data, automate repetitive reporting tasks, and run analyses that would be impractical or impossible in a spreadsheet.
What Employers Actually Want: The Full Stack, Not a Replacement
A common misconception is that learning Python means abandoning Excel. In reality, the strongest candidates in 2026 are fluent across the full stack — not specialists in just one tool. The core expectation across most current job postings centers on a combination:
- Strong SQL — joins, window functions, and CTEs, required in nearly every analyst interview
- Advanced Excel — pivot tables, lookup formulas, and simple modeling; still expected, but at a genuinely advanced level, not just basic spreadsheet familiarity
- Python — for data cleaning, automation, and analysis beyond what a spreadsheet can handle
- At least one BI tool — Power BI or Tableau, for building dashboards and communicating insights visually
An analyst comfortable across SQL, Python, and Excel together is measurably more versatile and more hireable than someone who has mastered only one of these in isolation.
How to Close the Gap: A Practical Learning Path
For those currently strong in Excel but new to Python, a focused, practical approach works far better than trying to learn everything from scratch simultaneously:
- Start with Python fundamentals — basic syntax, data types, and control structures, ideally through hands-on practice rather than passive video-watching
- Move directly into Pandas — this single library covers the vast majority of what a working analyst actually needs day to day
- Practice on real, messy data — pick a genuinely interesting dataset (local city data, sports stats, personal finance trends) and try to answer a real question using only Python; a single focused afternoon like this often teaches more than many hours of guided tutorials
- Layer in visualization — Matplotlib and Seaborn, so you can present findings clearly, not just process them
- Keep Excel and SQL sharp simultaneously — this is additive skill-building, not a replacement; employers want candidates fluent across the full stack, not someone who abandoned Excel for Python
Why This Matters Beyond Just “Getting Hired”
Beyond initial hiring, this skill combination matters for long-term career growth. Analysts who add Python to a strong Excel and SQL foundation are far better positioned to eventually move into more advanced data science or machine learning roles, since Python is the shared foundation across both fields. Someone who stops at Excel alone faces a much steeper transition if they later want to move into more technical, higher-paying data roles.
Where to Build This Skill Combination in Dehradun
TGC Dehradun’s Data Science Course is specifically designed to close this exact gap covering Python fundamentals, Pandas, and data visualization alongside SQL and machine learning basics, giving students the full, in-demand skill stack rather than an isolated single tool.
For those who want to start with a more analytics-focused foundation before advancing further, the dedicated Data Analyst Course covers Excel, SQL, Power BI, and Python together mirroring exactly the combination current job postings are asking for.
Students who want to build strong Python fundamentals specifically, as a foundation for either analytics or broader programming work, can also explore TGC Dehradun’s dedicated Python Course, covering core language skills and the key libraries used across data analytics and data science work.
Final Thoughts
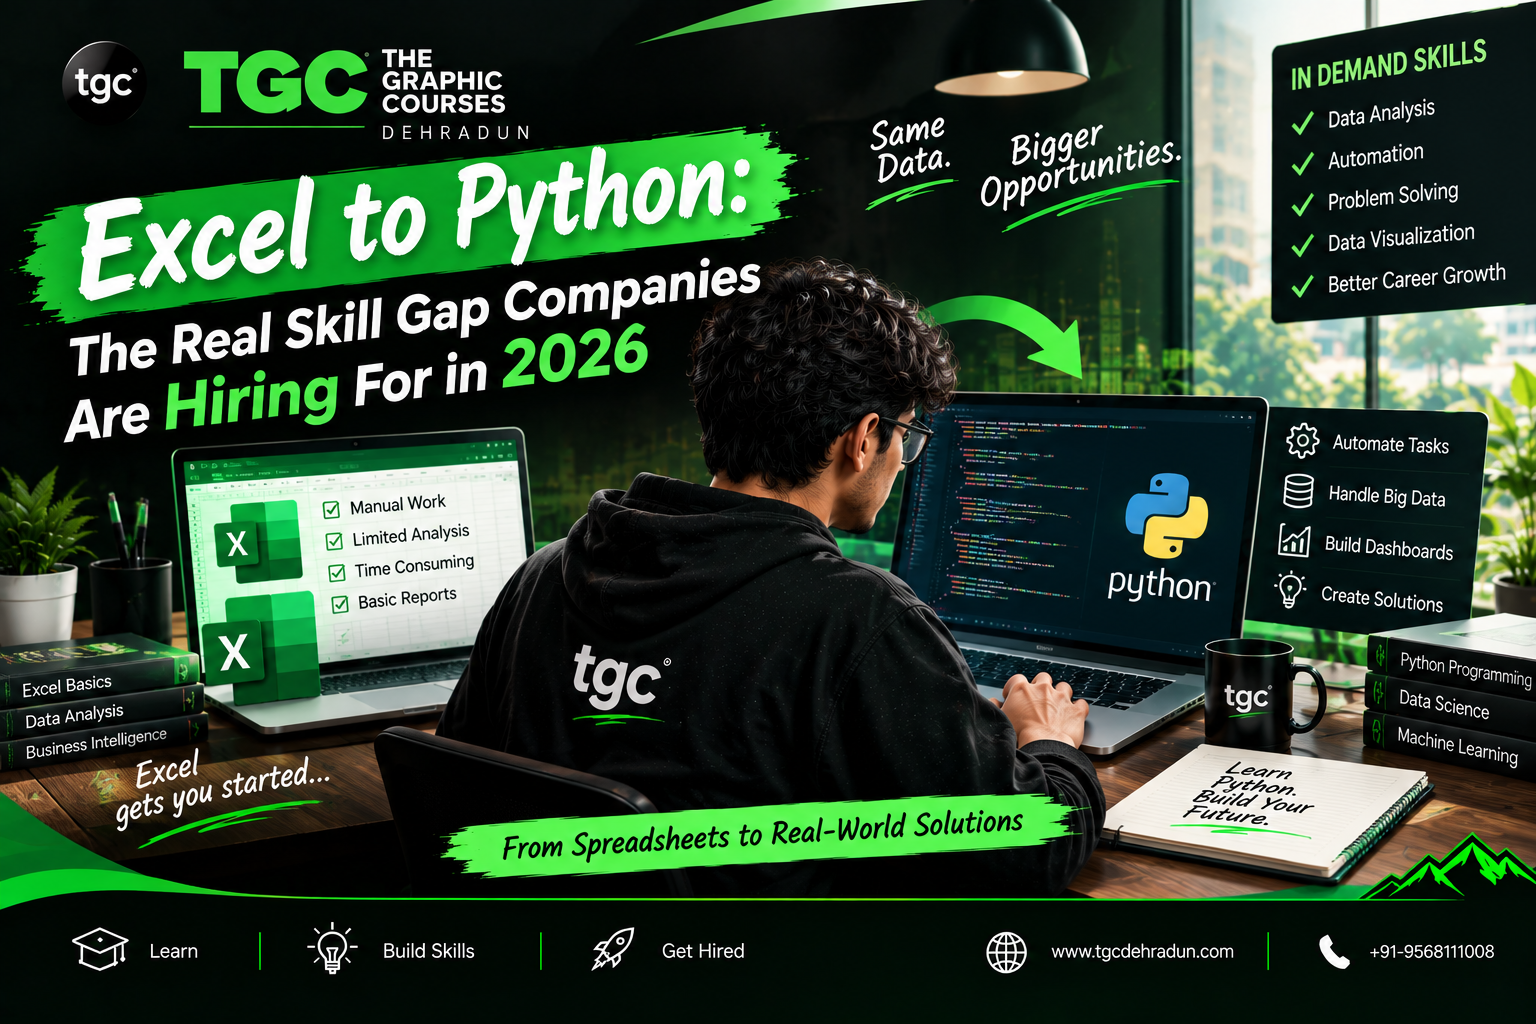
The “Excel vs. Python” framing is genuinely misleading the real skill gap companies are hiring for in 2026 isn’t about choosing one over the other, it’s about who has both. Excel remains a genuine, widely-required baseline skill, especially in the Indian job market. But Python has become the clearest signal of a more advanced, better-paying analyst the skill that separates candidates who get filtered through from those who get offered the stronger roles.
For anyone building a data career today, the smartest move isn’t abandoning Excel it’s deliberately layering Python on top of it, because that combination is exactly what the highest-value roles in 2026’s data job market are asking for.
Ready to close the Excel-to-Python skill gap? Explore TGC Dehradun’s Data Science and Data Analyst courses and get hands-on, project-based training designed to get you hired.